First, I create a table that contains the count of nodes per pixel. I fill this this table with a create table... as ...count(*).... group by. The values for the variables a through f determine the aspect ration and the size of the resulting picture:
create table count_per_pixel_ch as
select
count(*) cnt,
cast ( ( lon - a ) / c * e as int) x,
cast ( ( lat - b ) / d * f as int) y
from
node
group by
x, y;
x and y are unique. This pair represents a pixel on the final image. cnt is the number of nodes that fall into the area covered by a x/y pair.
After filling this table, I can iterate over each pixel and draw a color that is lighter for large pixel counts and darker for small pixel counts. I use the Python Image Library (import Image) to draw the image.
import Image
#
# Code filling the table
#
for r in cur.execute("""
select x, y, cnt
from count_per_pixel_ch
where x >= 0 and x < {image_width_px} and
y >= 0 and y < {image_height_px}
""".format(
image_width_px = image_width_px ,
image_height_px = image_height_px)):
x = r[0]
y = image_height_px - r[1] - 1
cnt = float(r[2])
blue = int(float(cnt)/float(avg_count_per_pixel) * 255.0)
green = 0
if blue > 255:
green = blue - 255
blue = 255
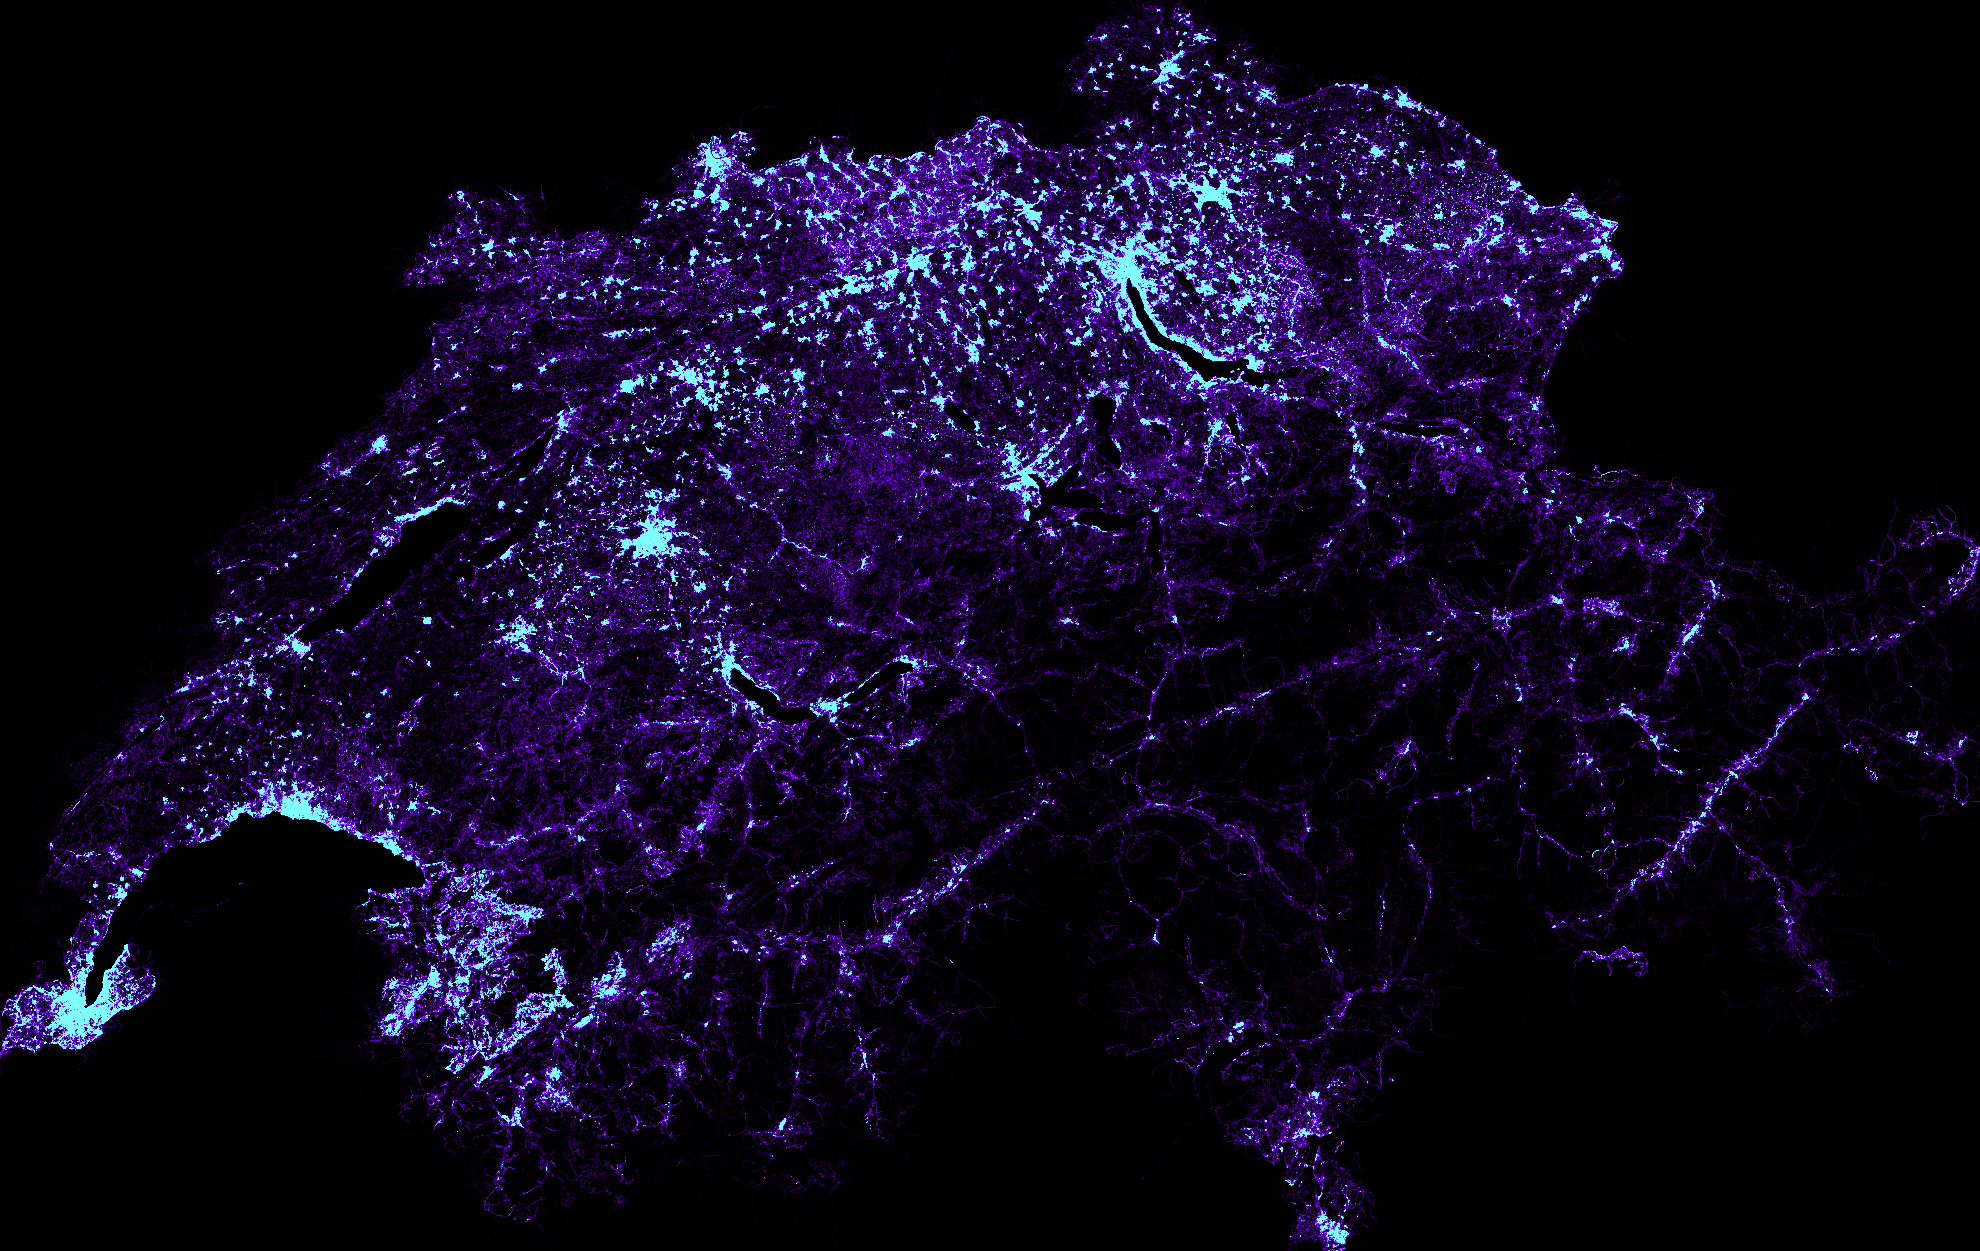
pixels[x, y] = (blue/2, green, blue)
Here's the result:

The same picture with a better resolution.
Links
Source code on github