Showing posts with label osm. Show all posts

Saturday, October 4, 2014

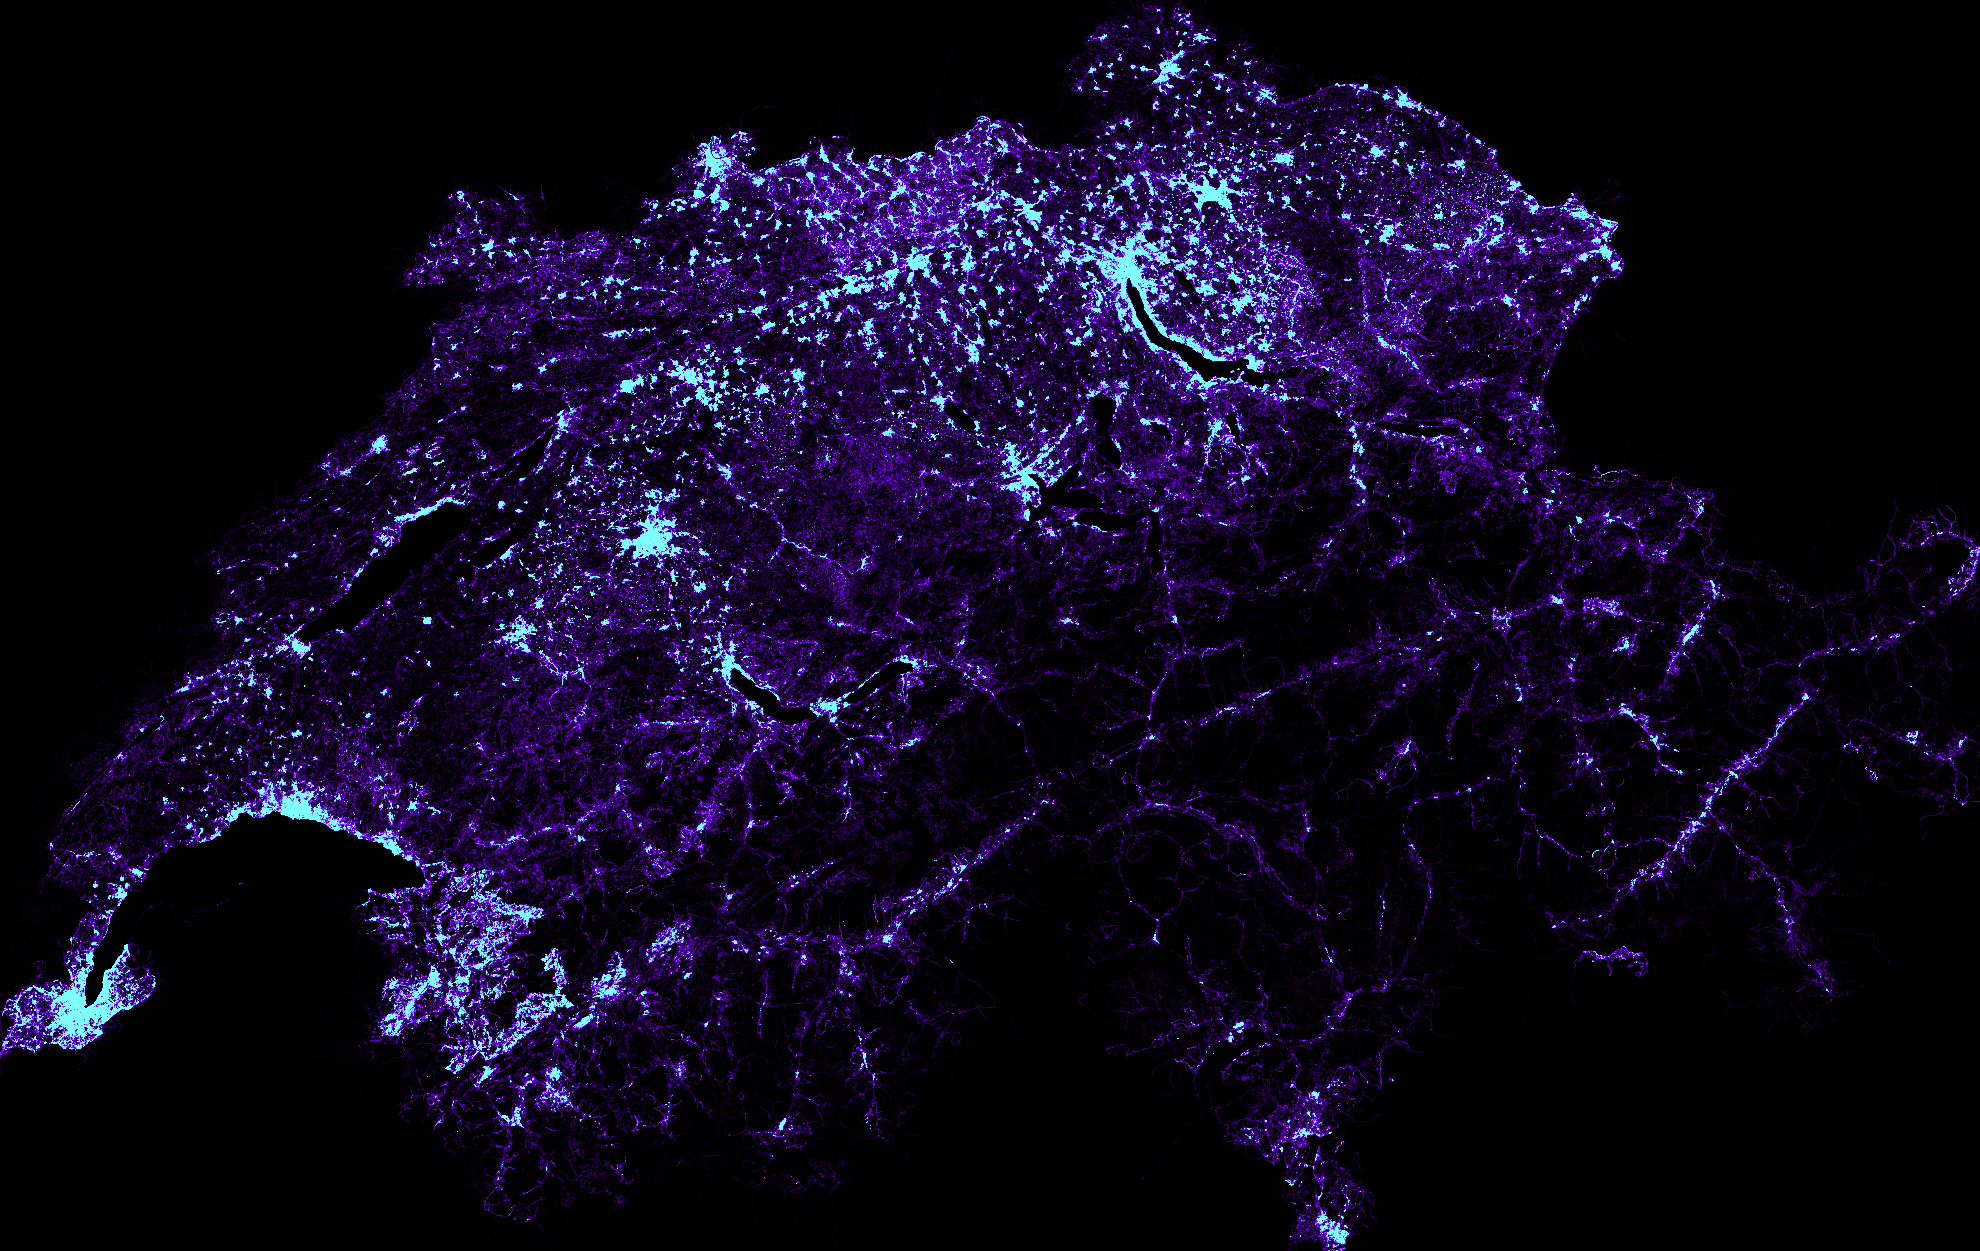
An open street map node density map for Switzerland

I'd like to know how open street map nodes are distributed in Switzerland, that is, I want to map their density on an image. This should be a fairly easy task with Python since I have already loaded Switzerland into an sqlite database (See OpenStreetMap: convert an pbf to an sqlite database with Python and download-switzerland-pbf.py [github]).

First, I create a table that contains the count of nodes per pixel. I fill this this table with a create table... as ...count(*).... group by. The values for the variables a through f determine the aspect ration and the size of the resulting picture:

create table count_per_pixel_ch as select count(*) cnt, cast ( ( lon - a ) / c * e as int) x, cast ( ( lat - b ) / d * f as int) y from node group by x, y;

x and y are unique. This pair represents a pixel on the final image. cnt is the number of nodes that fall into the area covered by a x/y pair.

After filling this table, I can iterate over each pixel and draw a color that is lighter for large pixel counts and darker for small pixel counts. I use the Python Image Library (import Image) to draw the image.

import Image # # Code filling the table # for r in cur.execute(""" select x, y, cnt from count_per_pixel_ch where x >= 0 and x < {image_width_px} and y >= 0 and y < {image_height_px} """.format( image_width_px = image_width_px , image_height_px = image_height_px)): x = r[0] y = image_height_px - r[1] - 1 cnt = float(r[2]) blue = int(float(cnt)/float(avg_count_per_pixel) * 255.0) green = 0 if blue > 255: green = blue - 255 blue = 255 pixels[x, y] = (blue/2, green, blue)

Here's the result:

The same picture with a better resolution.

Source code on github

Wednesday, October 1, 2014

A Google Earth hiking map for the Säntis region with Open Street Map data

After I have loaded a Switzerland pbf file (see download-switzerland-pbf.py or download-switzerland-pbf.bat) into an sqlite database (see OpenStreetMap: convert an pbf to an sqlite database with Python ), I can use this data to create a Google Earth kml file that highlights objects found in Open Street Map.

I am particularly intersted in creating an SAC hiking map for the Säntis region. For that end, I chose osm ways that have a tag named sac_scale.
Additionally, I restricted the respective nodes to the lattitude longitude for the Säntis region.

These ways are kept in a specific table:

create table sac_ways_around_saentis as select distinct wy.id way_id from tag tg join way wy on wy.id = tg.way_id join node_in_way nw on wy.id = nw.way_id join node nd on nd.id = nw.node_id where nd.lat > 47.2210118322 and nd.lat < 47.2604651483 and nd.lon > 9.3149215728 and nd.lon < 9.3959004678 and tg.k = 'sac_scale'

With this table, I can now extract the lattitude/longitude pairs for each node in the relevant ways and write them into a kml file.

The algorithm basically boils down to:

select way_id from sac_ways_around_saentis -- with each way_id: select node_id from node_in_way where way_id = ? order by order_ -- with node_id select lat, lon from node where id = ? -- Emit lat, lon into kml file
Of course, I would use a Python script for this (sac_ways_saentis.py on github).

Here's a screen shot of the result: